I’ve been building a sports-betting model for a while, starting with NFL spreads. Until now, the only person who could see how it was doing was me, and I’m not a neutral judge. So I put it on the internet so I can build in public: lines.jamespenning.dev.
What it is
Lines is a read-only dashboard. Every week it shows each game with two numbers side by side: the line my model (Pickle Projections) thinks is fair, and the line the market is offering. The gap between them is the interesting part. A small gap means the model and the market basically agree. A big one means one of us is wrong, and history says it’s usually me.
Right now only the NFL board is open. College football and the NBA run through the model too, but their public boards aren’t up yet (work-in-progress)
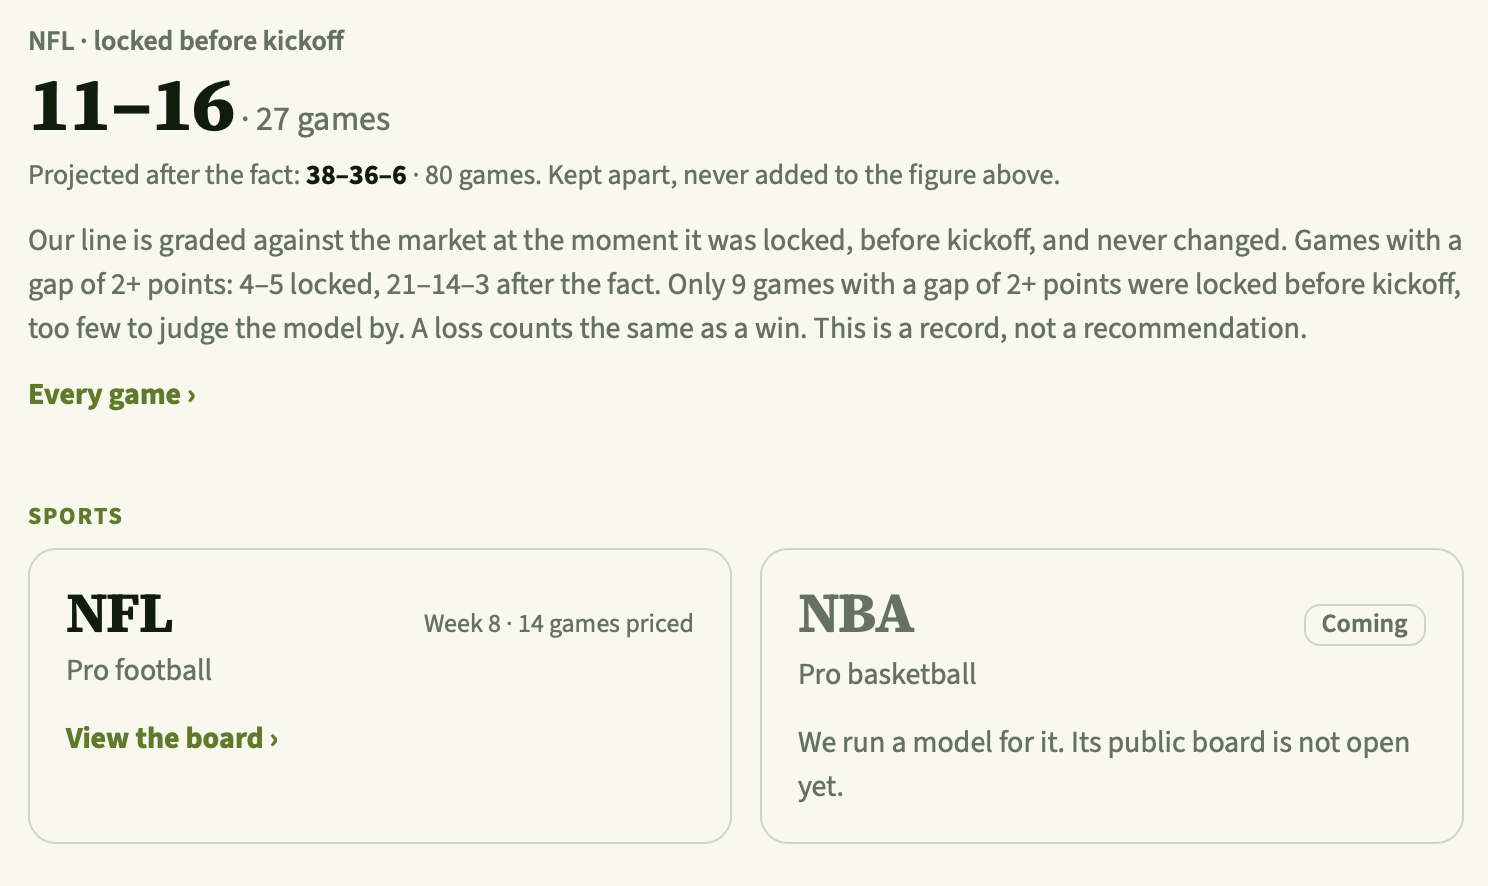
The home page: the locked record first, the after-the-fact record kept apart beneath it, then one card per sport.
Yes, the name is silly, on purpose. Every new sports-betting app seems to be called something like Odds Sweeper, Line Mate or Model Edge (I know because I owned the modeledge.com domain over a year ago to try and rollout an app), and I didn’t want to sound like them. I’m trying not to take this too seriously, and I really like pickles.
Graded in public
This is the part I care about. My line for each game is locked before kickoff, graded against the market price at that moment, and never changed afterwards. A loss counts the same as a win.
It’s very easy to fool yourself with a model. You run it on last season, it looks great, and you forget it already knew how last season ended. Lines keeps those two things apart. Games the model projected after the fact get their own record, and they’re never added to the locked one.
As I write this, the locked NFL record is 11-16. That’s not good. It’s also only 27 games, and only 9 of them had a gap of 2+ points, which is far too few to say anything about the model yet. The site says that right under the number, because I’d rather show a bad record honestly than a good one I can’t trust.
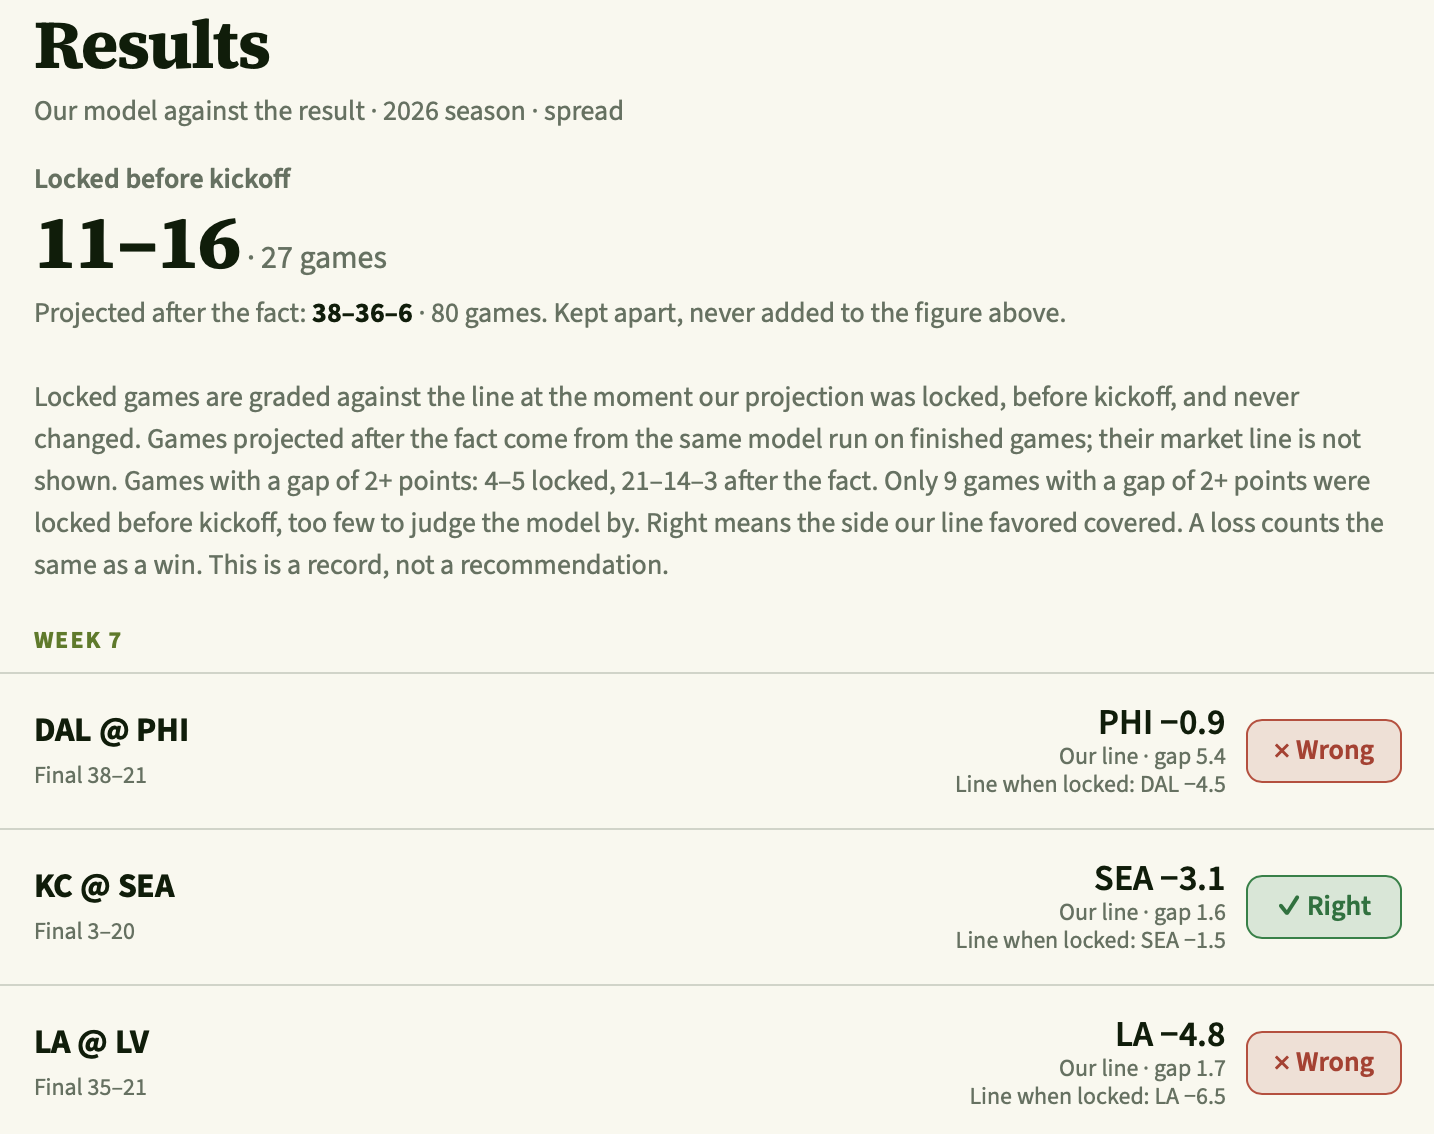
The results page lists every graded game with our line, the market’s line when we locked, and the final score. Wrong rows stay on the page.
That’s the same thing I did for years as a tester: write down what you expect before you run it, then report what actually happened.
How it’s built
It’s a static site on GitHub Pages, like this blog. Lines come from The Odds API, as the consensus of five retail books (DraftKings, FanDuel, BetMGM, theScore and Caesars), and NFL schedules and scores come from nflverse. The model and the price capture run on a Windows server of mine. It pulls prices every two hours, and every 15 minutes in the hour before the Thursday, Sunday and Monday kickoff windows. Once an hour the site is rebuilt from that server and published. If the newest price is more than six hours old, the publish stops and the last good version stays up, so the site never shows stale numbers as current.
One small detail I like: if a number has moved since your last visit, it rolls into place, so you can see what changed at a glance. That memory lives in your own browser. Nothing gets sent anywhere.
What it isn’t
It’s not picks, and it’s not advice. It’s a record. If you want to follow along, the results page has every graded game, and I’ll write here about what I learn, including when the model is wrong.
You can find Lines and my other projects on the Projects page.